thomas0988
- 浏览: 471868 次
- 性别:

- 来自: 南阳
-

文章分类
最新评论
-
yuanhongb:
这么说来,感觉CGI和现在的JSP或ASP技术有点像啊
cgi -
draem0507:
放假了还这么勤啊
JXL操作Excel -
chenjun1634:
学习中!!
PHP/Java Bridge -
Jelen_123:
好文章,给了我好大帮助!多谢!
hadoop安装配置 ubuntu9.10 hadoop0.20.2 -
lancezhcj:
一直用job
Oracle存储过程定时执行2种方法(转)
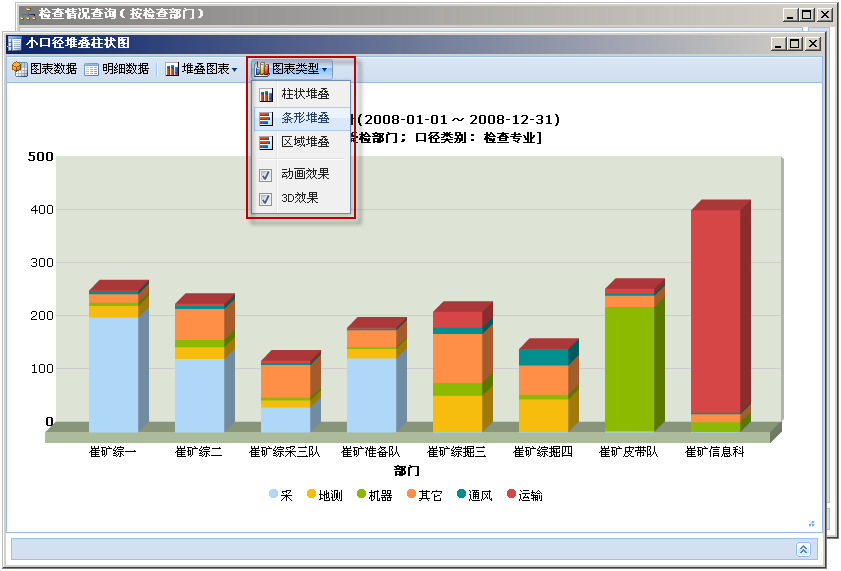
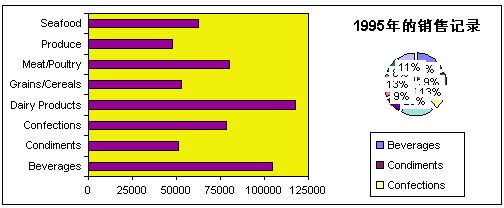
整理一些可以在Web开发中使用的图表控件, 主要为客户端实现方式, 如Flash, JavaScript, Silverlight; 如果是GDI+方式生成统计图表可以看我前几天整理的另外一篇博文C# WinForm开发系列 - Chart Controls .


I hope you enjoyed reading this article. You may subscribe to my RSS Feed, scroll down to leave a comment, or get back to the homepage.
Site Tour Creator
List of Ajax form Validators
Rounded Borders in CSS without Images
Great Accordion Scripts
蛙蛙推荐:利用OWC创建图表的完美解决方案
另外附上C# WinForm开发系列相关文章如下:
野路子实现的轻量级伪OLAP展示(FusionCharts)
10 Free Chart Scripts 转载自 S.Sams 博文
This week I’ve been working on a project that required data to be shown visually. I needed a Chart Script that was attractive yet gets the data across. The Charts scripts below are built using JavaScript, Flash, Silverlight, and Java.
-
Flot - Flot is a pure Javascript plotting library for jQuery. The focus is on easy usage , attractive plots and interactive features. With Flot you can interact with the data, look at specific data by zooming in, plot a time series, and other various options.

-
Open Flash Chart - Open Flash Chart is a Flash charting component. It is fairly easy to setup and has classes written in PHP, Perl, Python, Java, Ruby on Rails, and .Net to connect to the Chart. You can create some really nice looking Bar Charts, Pie Charts, Area Charts and etc…

-
AmCharts - AmCharts are animated interactive flash charts. The charts include Pie Charts, Line Charts, Scatter/Bubble Charts, Bar/Column Charts, and even a stock chart. AmCharts can extract data from simple CSV or XML files, or they can read dynamic data generated with PHP, .NET, Java, Ruby on Rails, Perl and ColdFusion. All the charts are free but they have a link to AmCharts on the upper left.

-
Emprise JavaScript Charts - Emprise JavaScript Charts is a 100% Pure JavaScript Charting Solution that requires no JavaScript frameworks. Emprise JavaScript Charts include Line, Area, Scatter, Pie, Bar charts with zooming, scaling and scrolling ability. Tested and works with all major browsers.

-
PlotKit - PlotKit is a Chart and Graph Plotting Library for Javascript. PlotKit works with MochiKit javascript library. It has support for HTML Canvas and also SVG via Adobe SVG Viewer and native browser support. PlotKit also has great documentation.

-
Flotr - Flotr is a javascript plotting library based on the Prototype Framework version 1.6.0.2. Flotr lets you create graphs in modern browsers with features like legend support, negative value support, mouse tracking, selection support, zoom support, event hooks, CSS styling support and much more.

-
PHP/SWF Charts - PHP/SWF Charts is simple yet powerful tool to create attractive web charts and graphs from dynamic data. You use PHP to gather the data and put it into flash. It supports many charts types, Line, Column, Stacked column, Floating column, 3D column, Stacked 3D column, Parallel 3D column, Pie, 3D Pie, Bar, Stacked bar, Floating bar, Area, Stacked area, Candlestick, Scatter, Polar, Mixed, Composite and Joined. These Charts have some great features like Animated transitions, Printable charts, and more.

-
Visifire - Visifire (Powered by Silverlight) is a set of open source data visualization components. With Visifire you can create animated Silverlight Charts with ASP, ASP.Net, PHP, JSP, ColdFusion, Ruby on Rails or just simple HTML.

-
FusionCharts - FusionCharts is a cross-browser and cross-platform flash charting component that can be used with ASP.NET, ASP, PHP, JSP, ColdFusion, Ruby on Rails, simple HTML pages or even PowerPoint Presentations. All you need to know is the language you’re programming in.

-
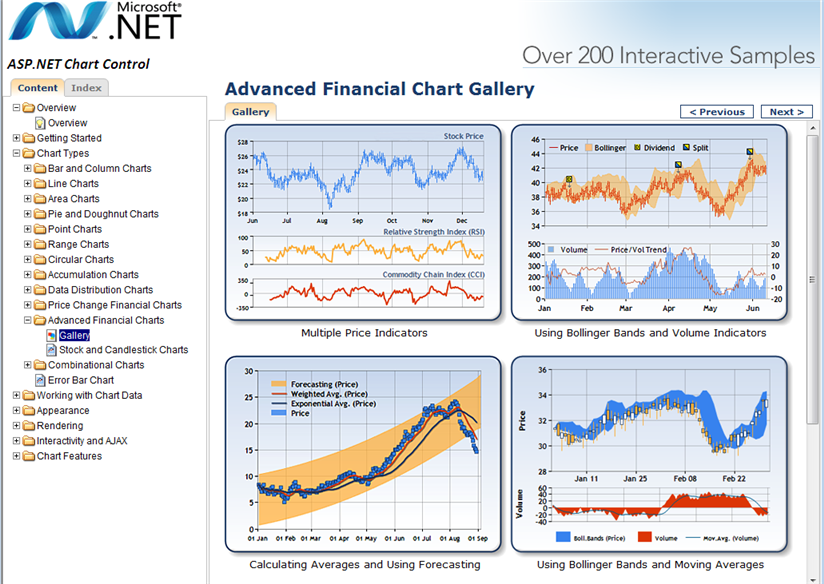
JFreeChart - JFreeChart is an open source Java chart library that makes it easy for developers to display quality charts in their applications. The JFreeChart project was founded seven years ago, in February 2000, by David Gilbert and is used by approximately 40,000 to 50,000 developers. JFreeChart supports many different output types that includes JPEG, GIF, PDF, EPS and SVG. This is a great resource for Java developers.

If you know of any other Charting Scripts please post below.
Popularity: 37%
I hope you enjoyed reading this article. You may subscribe to my RSS Feed, scroll down to leave a comment, or get back to the homepage.
Related Posts
Free Flash Charting ComponentSite Tour Creator
List of Ajax form Validators
Rounded Borders in CSS without Images
Great Accordion Scripts
作者:peterzb(个人开发历程知识库 - 博客园)
出处:http://peterzb.cnblogs.com/
文章版权归本人所有,欢迎转载,但未经作者同意必须保留此段声明,且在文章页面明显位置给出原文连接,否则保留追究法律责任的权利。
蛙蛙推荐:利用OWC创建图表的完美解决方案
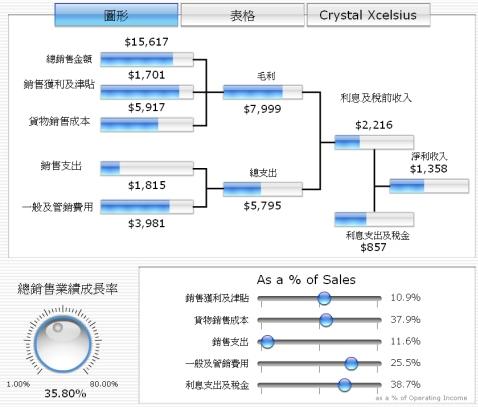
Business Objects中的Crystal Xcelsius
另外附上C# WinForm开发系列相关文章如下:
分享到:


发表评论

-
mysql 定时任务
2015-11-03 09:57 728定时任务 查看event是否开启: show variabl ... -
tomcat服务器大数量数据提交Post too large解决办法
2015-10-29 11:05 699tomcat默认设置能接收HTTP POST请求的大小最大 ... -
Tomcat启动内存设置
2015-10-20 15:40 630Tomcat的启动分为startupo.bat启动和注册为w ... -
Java串口包Javax.comm的安装
2015-10-12 16:32 648安装个java的串口包安装了半天,一直找不到串口,现在终于搞 ... -
在 Java 应用程序中访问 USB 设备
2015-10-10 17:49 906介绍 USB、jUSB 和 JSR- ... -
自动生成Myeclipse7.5注册码
2015-08-11 16:46 433package com.rbt.action; impor ... -
mysql定时器
2015-08-04 14:01 5605.1以后可以使用 ALTER EVENT `tes ... -
oracle安装成功后,更改字符集
2015-07-23 11:53 592看了网上的文章,乱码有以下几种可能 1. 操作系统的字符集 ... -
js iframe 打印 打印预览 页眉页脚的设立
2015-06-08 15:21 1096js iframe 打印 打印预览 页眉页脚的设置 1、 ... -
不同小图标的编码网页中的大于号,小于号,应该用编码来代替,HTML中特殊字符和与之对应的ASCII代码
2015-06-08 14:44 3206上面两个符号的HTML代� ... -
利用html5调用本地摄像头拍照上传图片
2015-05-18 09:36 2565测试只有PC上可以,手机上不行 <!DOCTYPE ... -
必须Mark!最佳HTML5应用开发工具推荐
2015-05-15 22:50 921摘要:HTML5自诞生以来,作为新一代的Web标准,越来 ... -
Mobl试用二
2015-05-13 14:28 596最近有空又看了一下Mobl的一些说语法,备忘一下: 1 ... -
Nginx安装部署
2015-05-08 19:59 435Nginx ("engine x") 是 ... -
Nginx配置文件详细说明
2015-05-08 19:58 571在此记录下Nginx服务器nginx.conf的配置文件说明 ... -
table中的超长字符串用省略号表示的css样式
2015-05-06 15:54 1293<style> table td{white- ... -
axis调用cxf
2015-04-23 13:51 5131、写address时不用加?wsdl Service s ... -
js实现页面打印功能实例代码(附去页眉页脚功能代码)
2015-04-19 18:03 569<html> <head>< ... -
javascript:window.print() 打印
2015-04-17 17:03 5871.JavaScript打印<input id=&qu ... -
网页设置A4大小
2015-04-16 19:53 1168在公制长度单位与屏幕分辨率进行换算时,必须用到一个DPI(D ...
相关推荐
java web整合开发王者归来光盘代码-chart文件夹 (JSP+Servlet+Struts+Hibernate+Spring)
ComponentArt.Charting.WebChart-2008.1.1346_ASP.NET AJAX正式开发版控件
摘要 WebChart 8.0能让您更加简单便捷的为Active Server Page (ASP) 应用程序创建各种样式的图表。ComponentOne WebChart 8.0内置了ComponentOne Chart 8.0技术,因此您可以创建ComponentOne Chart 8.0中包括的所有...
.net web开发 使用的图形控件使用实例
Angular-ng-chartjs.zip,全功能angular2 chart.js library.ng-chartjs,Angularjs于2016年发布,是Angularjs的重写版。它专注于良好的移动开发、模块化和...angular的设计目的是全面解决开发人员的web应用程序工作流。
web图表工具chart,还有本人的一个小demo
Fusion chart Fex javascript web chart,包含开发包和实例代码
本实例通过使用webchart来实现直方图及饼图,开发环境VS2005直接运行即可
Asp.net 2.0 自定义控件开发[开发一个图表(WebChart)控件(柱状图示例)](示例代码下载)收藏
一个免费的报表控件dll适合做网页的报表开发
ComponentArt_WebChart_2008.1.1346.3_ASP.NET 1.0(含开发版序列号及源代码).请购买正版软件。切勿作为商业用途。
开发服务器为开发服务器运行ng serve 。 导航到http://localhost:4200/ 。 如果您更改任何源文件,该应用程序将自动重新加载。代码脚手架运行ng generate component component-name生成一个新的组件。 您还可以使用...
python Django web 实训项目的实验报告 类似于客户管理系统,实现对管理员账户 部门账户 用户账户 靓号账户 任务发布 的增删查改,实现导入导出excel数据,生成pdf, 上传图片媒体资源。用户登录期间,随机图片验证码...
asp.net 中web图表是很重要的一部分需求,可以通过本例可以快速掌握ms chart控件的开发技术。
全面、系统、深入介绍Java Web开发的核心技术与主流框架。 一线开发人员全力打造,分享技术盛宴! 内容全面:涵盖了Java Web开发所涉及的所有核心技术与主流框架 针对性强:以SSH框架整合开发为核心,可以满足...
建议 PR 名称遵循以下约定开发技术该项目是在 React 中开发的,因此我们邀请您阅读站点上的文档。你想捐赠吗? 捐赠的钱用于网站的维护,支付托管 Web 和 Graphql API 的服务器的月费,以及域的年费。贡献者 :...
Dialog (对话框) NavBar (导航条) Splitter (框架分离) WebChart Lite (图表) 如果涉及到安装序列号,请填写:3JKX6-YJW6X-GJJDP app_data为应用到的Sql和Access数据库文件 documentation下为官方的相关文档 Dll...
android-charts是一套基于Java和Android开发的图形图表控件. 目前该套图表主要包括以下组件: 网格图(gird chart) 线图...包括基本饼图和分割饼图 雷达图或蛛网图(radar chart or spider web chart) 包含面积雷达图
此Web应用程序是由WIUT的学生00009534开发的,以满足模块的要求。 它不代表任何真实的公司或产品。 应用目的: 此应用程序是为人力资源部门开发的,用于管理其员工。 它允许拥有一个单一的员工数据库并轻松地对其...
Welcome to Android-Charts ...Android-Charts is an open-source android developing framework written in JAVA on Android SDK. Android-Charts includes a set of very useful graphs/...spider web chart area ch